Selected work
02 / 02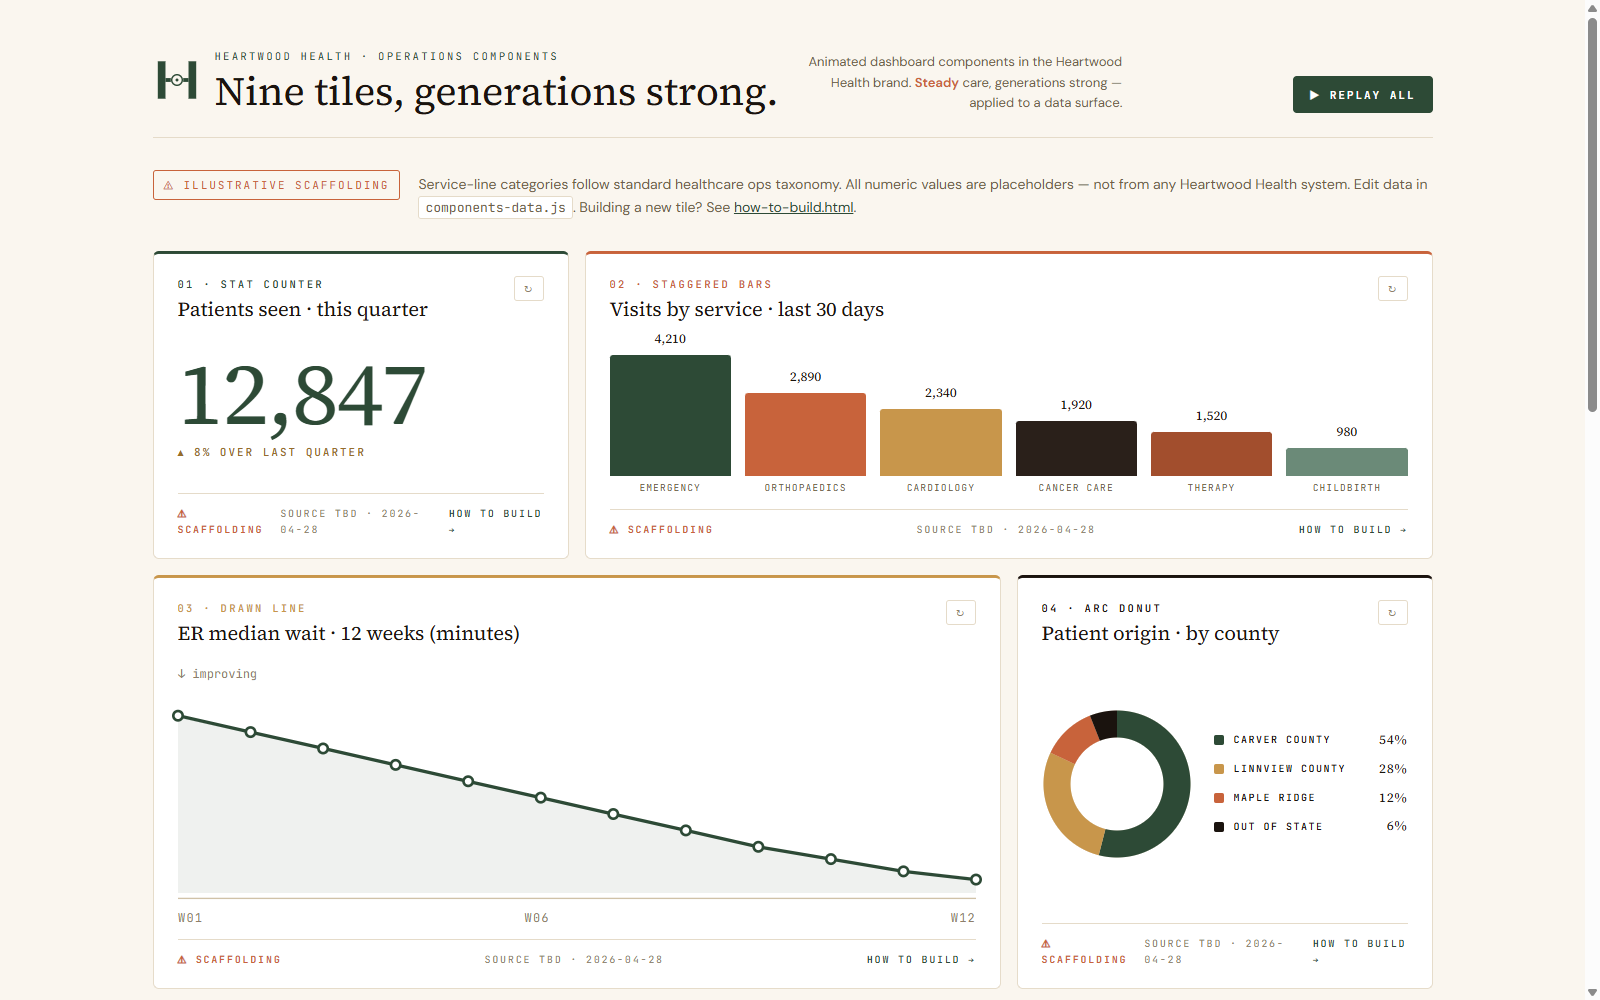
Heartwood Health · Operations Components
Nine animated dashboard tiles for a fictional rural-healthcare brand — stat counters, staggered bars, drawn lines, donuts, sankey, slope, heat-grid. Built to show how editorial branding survives translation to a live data surface.
Open dashboard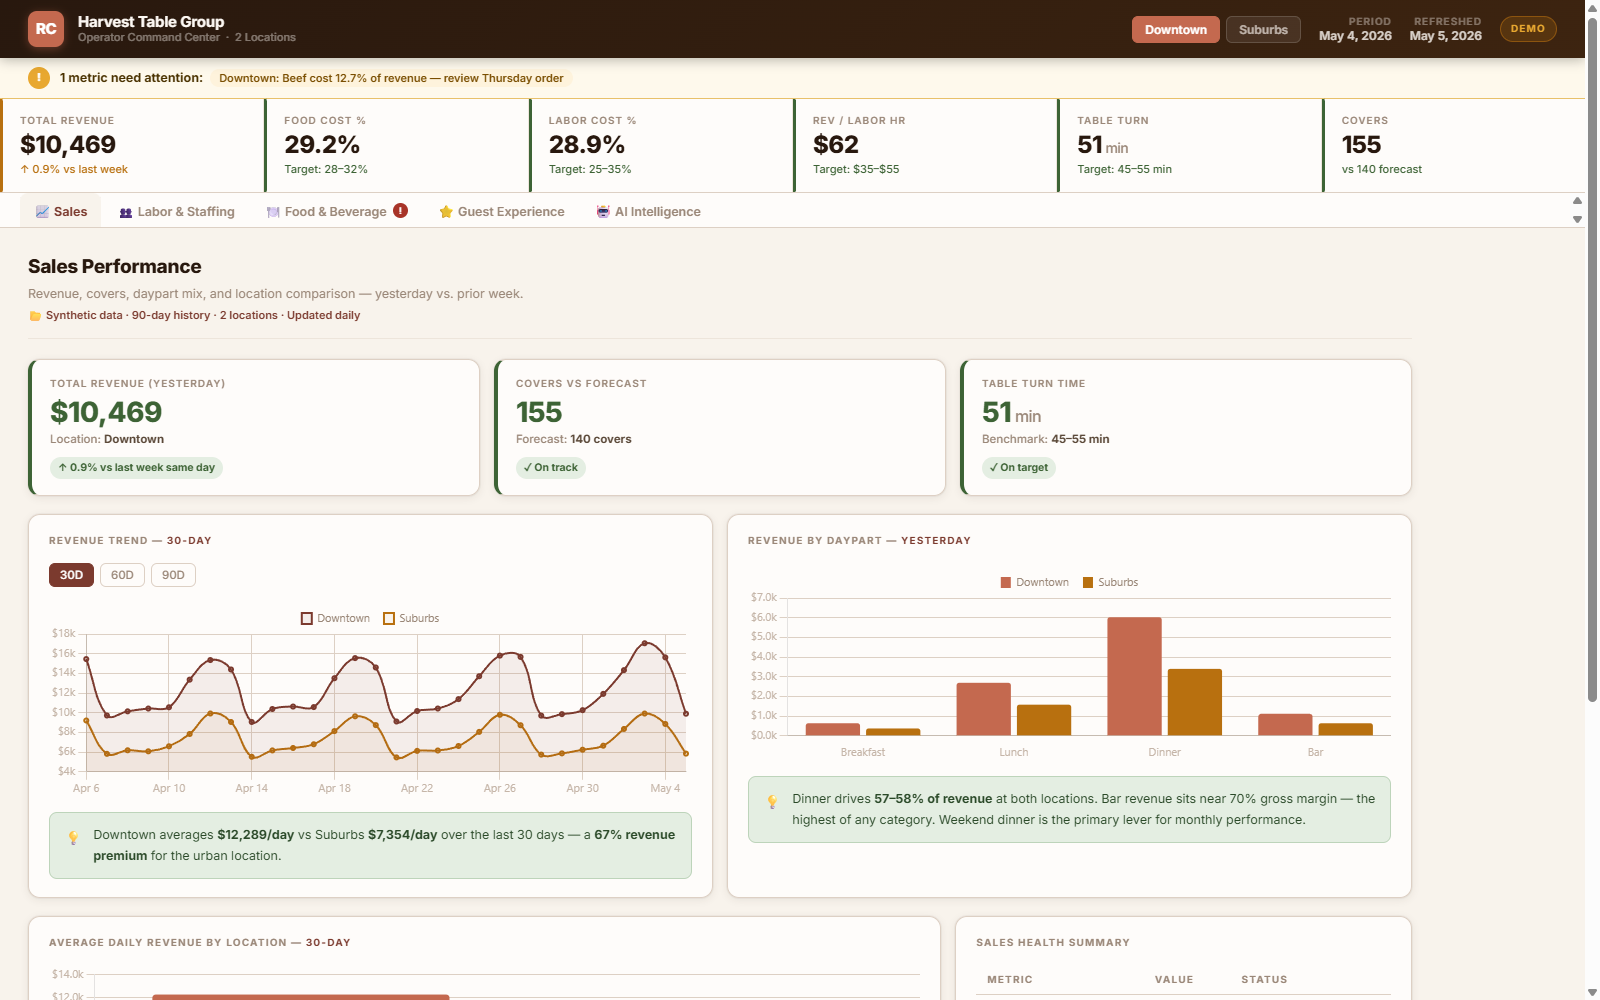
Harvest Table Group · Operator Cockpit
An operator command center for a fictional 2-location restaurant group. Five tabs cover sales performance, labor & staffing, food cost, guest experience, and an AI daily briefing — modeled as the kind of single surface a multi-unit GM actually needs at the start of a shift.
Open dashboardMore projects coming
The studio is just opening. Next up: a few experiments with public datasets, plus a deeper look at conversational analytics surfaces. Check back.